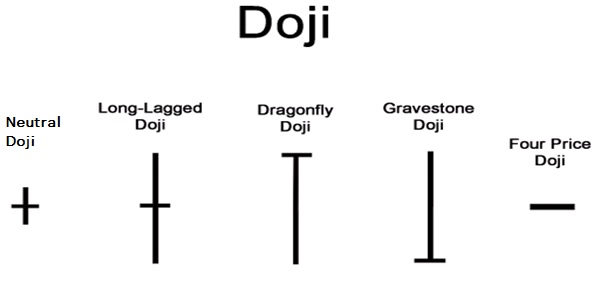
A Doji is formed when the opening price and the closing price are equal.
There are mainly five types of Doji & they are given below.
1. Neutral Doji.
2. Long Legged Doji.
3. Gravestone Doji.
4. Dragonfly Doji.
5. Four Price Doji.
Neutral Doji:
A Neutral Doji is a small candlestick pattern & look like a cross or plus sign.
This pattern occurs when the stock open and close at the middle of the day’s high and low.
Long-Legged Doji:
A long-legged Doji has the upper and lower shadows are much longer than the natural Doji. During any time, frame of the candle, the price dramatically moves up and down but closed at the same level that it opened.
This pattern forms when supply and demand forces are at equilibrium & this shows the indecision between the buyers and the sellers.
Gravestone Doji:
A gravestone Doji is formed when the opening and closing price are equal and occur at the low of the day.
This pattern forms when the supply and demand forces are at equilibrium.
Dragonfly Doji:
The Dragonfly Doji is formed when the opening and closing prices are equal and occur at the high of the day.
This form when the supply and demand forces are at equilibrium.
Four Price Doji:
Four Price Doji is simply a horizontal line without any upper & lower shadow, it looks like minus sign,
and the high, low, open and close prices of the candle are exactly the same.
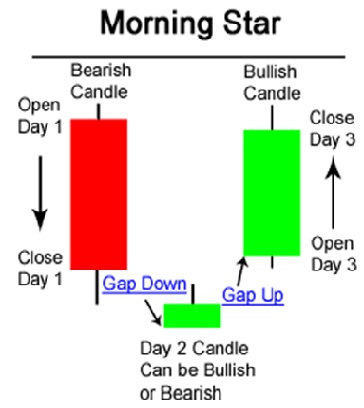
10. Morning Star:
The Morning Star Pattern is viewed as a Bullish reversal pattern, usually occurring at the bottom of a downtrend.
The Pattern consists of three candlesticks:
1. A long Bearish candle.
2. A small Bullish or Bearish candle or a Doji that opens at or below the close of the previous candle.
3. A green Bullish candle that opens at or above the high point of the previous candle and closes at or above the center of the first candle.
Criteria of taking Trades:
1. The first part of a Morning Star reversal pattern is a large Bearish red candle.
On the first day, bears are definitely in charge, usually making new lows.
2. The second day begins with a Bearish gap down. It is clear from the opening of Day 2 that bears are in control. However, bears do not push prices much lower.
The candlestick on Day 2 is quite small and can be Bullish, Bearish, or neutral (i.e. Doji).
3. Day 3 begins with a Bullish gap up, and bulls are able to press prices even further upward, often eliminating the losses seen on Day 1.
4. It forms at the Support level i.e on downtrend. After touching Support level the market will be reversed and will be in uptrend.
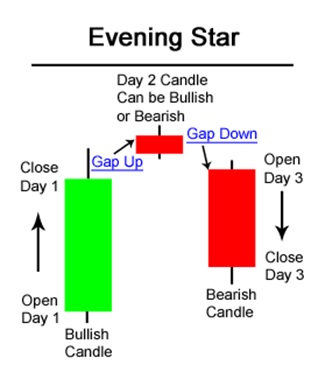
11. Evening Star:
The Evening Star Pattern is viewed as a Bearish reversal pattern that usually occurs at the top of an uptrend.
The Pattern consists of three candlesticks:
1) Large Bullish Candle (Day 1).
2) Small Bullish or Bearish Candle (Day 2)
3) Large Bearish Candle (Day 3)
Criteria of taking Trades:
1. The 1st part of an Evening Star reversal pattern is a large Bullish green candle. On the first day, bulls are definitely in charge, usually new highs were made.
2. The 2nd day begins with a Bullish gap up. It is clear from the opening of Day 2 that bulls are in control. However, bulls do not push prices much higher. The candlestick on Day 2 is quite small and can be Bullish, Bearish, or neutral (i.e. Doji).
3. Day 3 begins with a gap down, (a Bearish signal) and bears are able to press prices even further downward, often eliminating the gains seen on Day 1.
4. It forms at the Resistance level i.e on uptrend. After touching Resistance level the market will be reversed and will be in downtrend.